The year 2020 will be remembered for when the world stood still; and for the market rebounding like never before.
The pandemic put a stop to the decade-long market rally – the S&P 500 enjoyed 13.56 percent CAGR for 10 years through Dec 31, 2019 – and triggered a free fall to 34 percent below its record by end of March 2020.
However, the jaw-dropping fall in Q1 2020 might seem like a hazy memory; one that has been replaced by the dizzy rally of the S&P 500 posting its best 12-month performance in history between Mar 23, 2020, and Mar 23, 2021, gaining 74.8 percent.
This all-equities rally fuelled investors who are willing to accentuate their stellar stock-picking record and shun professional fund managers.
For informed investor, this period looked like a refresh of market fundamentals – most things that we thought we knew about market behavior had to be relearned or revisited.
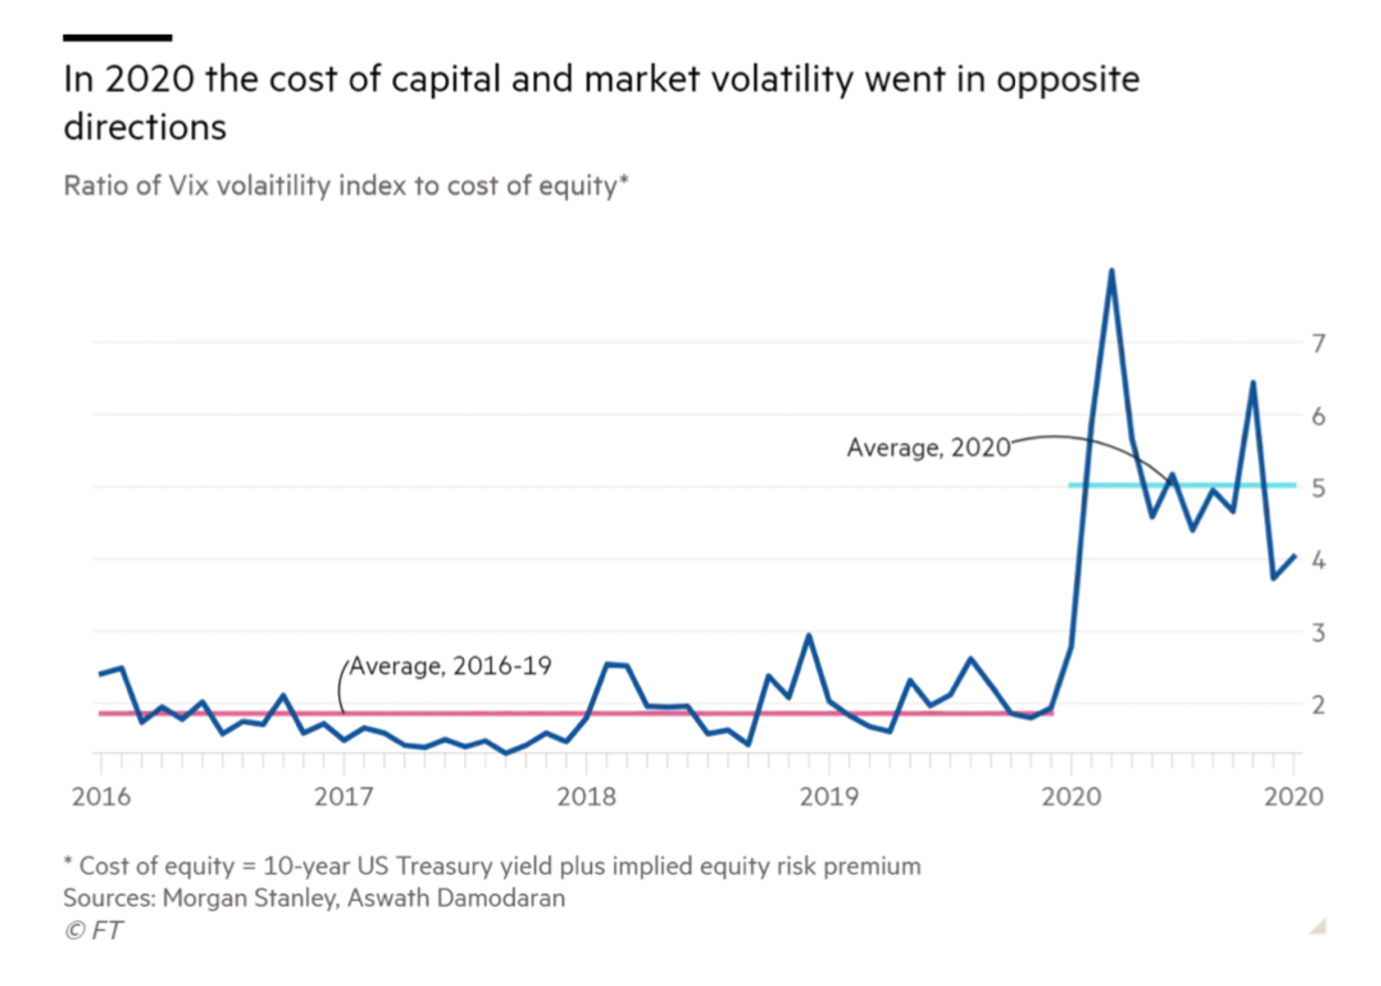
For instance, the cost of capital and volatility almost always move in lockstep because investors require a higher expected return when the world looks riskier. But in 2020, the cost of capital and volatility went in opposite directions.
When the price of many stocks and bonds plunged, central bankers referred to a playbook created during the 2008 financial crisis. Prescribed actions included lowering interest rates, purchasing securities on the open market, lending to businesses on favourable terms and providing households with money to ease their burdens.
Companies therefore received a richer valuation on greater current or prospective earnings.
_____________________________________________________________________________________
In fact, some fingers pointed at the Federal Reserve for taking the bottom out of the market with an overdose of cheap money for companies; this drove a boost in firm valuations which in turn stoked the market to new heights – arguably a buoyant, self-reinforcing cycle.
In addition, as vaccines became widely available, we saw a significant sector rotation from value to growth stocks in Q1 2021. Though there continues to be healthy debate about the depth and sustainability of such a shift.
Lastly, there is the looming specter of inflation that has been reflected in higher bond yield (low bond prices).
The above, in part, explains why the market was booming in 2020 during a year of human suffering.
In light of these observations from 2020, how should we think about investing when fundamentals are not constant and bound to shift?
_______________________________________________________________
Navigating market fundamentals
Different hedge fund investment styles offer varying degrees of market risk correlation with macroeconomic factors; and a wide range of approaches to mitigating the correlation.
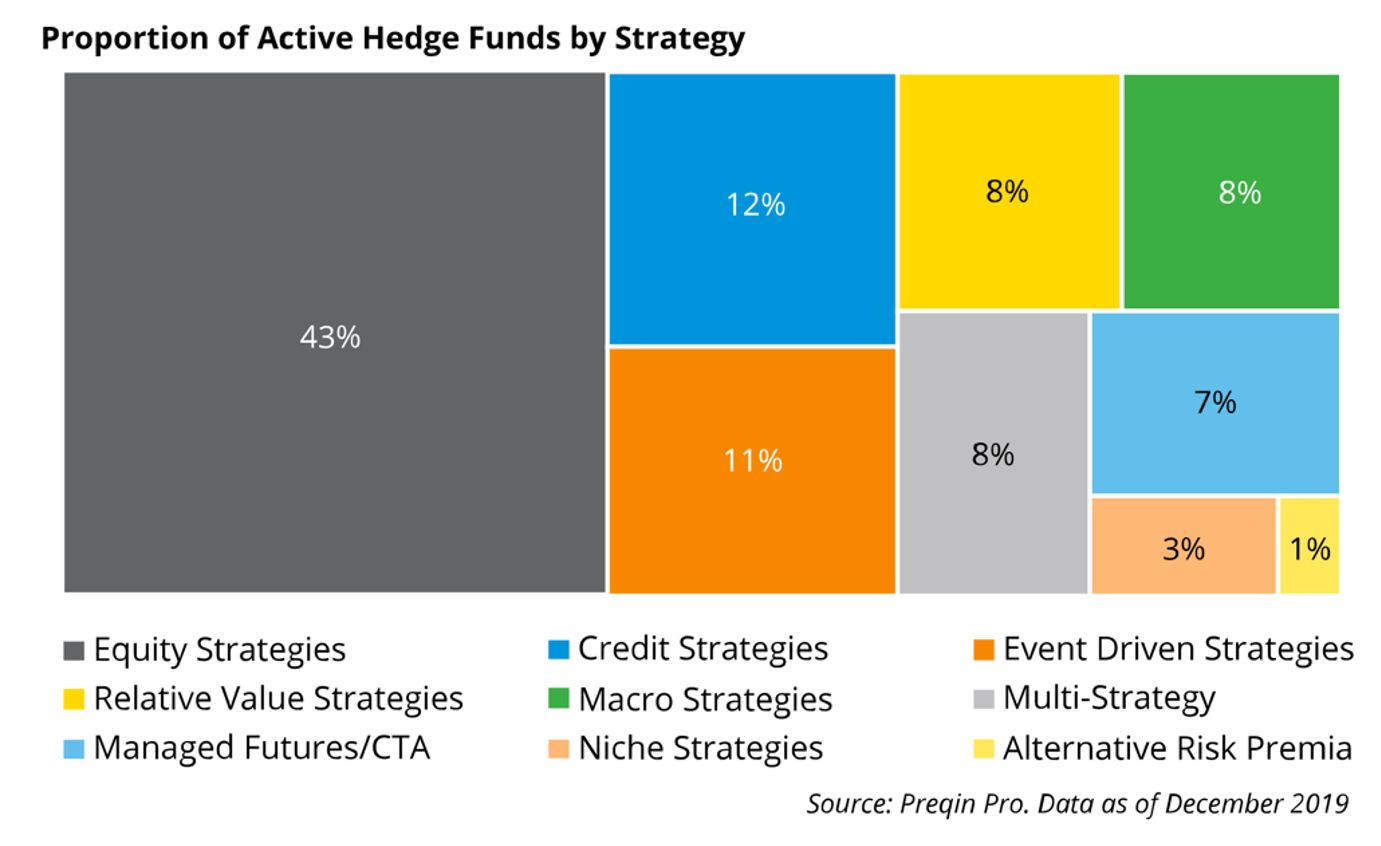
Though, for the most parts, when a typical investor asks how a fund has adapted to changes in market conditions or inquire about the portfolio manager’s point of view about macroeconomic factors, the investor generally has fundamental, discretionary equity strategies in mind.
This is because equity strategies (long and long/short) represent 43 percent of the industry.
Hence, equity strategies, being the strategy that most investors most easily relate to, are the de facto reference point and, in turn, have a lion share of both AUM and mind share.
_______________________________________________________________
AQM and market fundamentals
Using AQM as a case study, one of the strategy’s overarching value propositions is that it does not take directional bets during shifts in market fundamentals/conditions, including shifts as dramatic as the ones we saw in 2020 and Q1 2021.
This is underscored by the fact that AQM adopts a non-discretionary approach: A rules-based approach removes behavioral bias from the buy-and-sell decision-making process; and lessens the chance that the portfolio manager will make poor decisions based on emotional responses to market conditions.
Three useful observations about AQM’s investment approach and characteristics:
1. Trading model diversification is how AQM navigates changes in market fundamentals.
- From a statistical lens, AQM has assembled a resilient set of trading models that, in the long run, has a high probability of beating the market.
- The goal is not to have the prefect trading model. Instead, the aim is to have 33 “good enough” trading models with uncorrelated return-to-risk profiles that, on the whole, has the highest statistical likelihood of delivering outperformance.
- A simple example is the AQM Modified Yale Portfolio: A long-only model which has served the Yale Endowment very well for the past two decades. This is one of the time-tested models in AQM that has proven itself to be able to weather numerous shifts in market fundamentals.
2. AQM is not immune to shifts in fundamentals.
- To cite an example at an asset class level, due to low bond prices (U.S. Treasuries), AQM was flat in early 2021. i.e. Gains in the portfolio were damped by the drag in bond holdings.
- Buffett’s diagnosis is that bond investors face a bleak future; however, AQM’s data-driven approach is to hold, not sell, bonds. Because statistics show that, in the long run, bonds serve as a good hedge. If AQM research uncovers a better, more suitable asset class/trading model, a replacement or addition will be considered.
- The human mind is wired to make sense of patterns and arrive at deductions. i.e. If X is bad, take corrective action to replace X with Y. But our minds are ill suited to objectively process statistics and probability.
- To clarify, this is not a dig at Buffett but a difference in investment philosophy. In fact, Buffett is likely to agree that, for a hedge fund, the value of a holding is relative to the other holdings and the fund’s overall investment objectives.
- Hence, to be an AQM investor is to have the discipline to lean into statistics (signal) and suppress the urge to react to short-term directional bets (noise).
- In practice, during times of either novel market “noise” or new investment research findings, AQM conducts due diligence and revisits the first principal of why the trading model/asset class was included in the first place. A quantitative and qualitative assessment is conducted, with third-party peer review where possible, to justify the model/asset class and its behavior in various market conditions.
3. Trust but verify statistics.
- Given the material shifts in market fundamentals, is historical data and statistics still reliable or relevant?
- Using momentum strategy as an example, this blog post does an excellent job of explaining that “even the best evidence-based active investment strategies can create a formidable challenge” and inflict periods of doubt and pain for investors.
- Candidly put, the AQM portfolio manager is not (yet) supplanted by data or AI because managing and maintaining an investment portfolio is a delicate balance between art and science.
In sum, AQM’s response to changes in market conditions is to trust the model. The above three reasons outline why AQM advocates trust in the process/model and does not react to shifts – even ones as material as those in 2020/2021 – in market fundamentals.
In practice, this understandably confounds most investors because they are expecting to hear a straight-forward story about which holdings are up, which are down, and what corrective actions are being taken – which is diametrically opposed to AQM’s rules and data-based investment philosophy.
_______________________________________________________________
Conclusion
A quant approach to investing is often referred to as evidence-based. (Not that this makes it any easier or clearer for an average investor to comprehend.)
What this means is that a quant trusts in the data – or at least, their version and interpretation of the data.
The idea is to have a trading model that is not curve fitted and has taken into consideration various market conditions, especially during periods market corrections.
A quant approach does not purport to be able to predict future market conditions; however, a quant multi-strategy approach does strive to include multiple models that offer upside participation and downside protection.
In sum, markets are unpredictable and turbulent. A quant approach to be equipped with different trading models that are quantitatively capable of navigating the choppy waters.
____________
Appendix: 2020 select market milestones
Feb 19: The Nasdaq and S&P 500 rise to records on what turns out to be the last day of trading calm before the storm.
Feb 27: Coronavirus fears drive U.S. stocks into a correction, with the major U.S. stock indexes all down at least 12% from recent records. For the S&P 500, the move into a correction has taken just six trading days
Mar 11: The longest bull market for U.S. stocks ends as the Dow Jones Industrials close down 20.3% from their recent peak.
Mar 23: The S&P 500 closes 34% below its record of just over a month earlier.
Mar 24: Stocks soar on signs that lawmakers are nearing a deal on a big stimulus
package. The Dow Jones Industrials jump more than 11%, their best day in 87 years.
Mar 31: Despite a rebound in late March, U.S. stocks close their worst quarter since the financial crisis.
Jun 30: After the first-quarter rout, U.S. stocks recover with their best quarter in percentage terms in more than 20 years. The S&P 500 rose 20%, the Dow 18% and the Nasdaq 31%.
Aug 18: The S&P 500 closes at a record, erasing losses from the February-March plunge triggered by the pandemic.
Sep 30: Most consider the S&P 500 a broad representation of large corporations across industries and thereby a de facto indicator of the health of the U.S. economy. But when six companies account for nearly 25% of the index and 77% of its gains over the 12 months through September, this high-octane growth-stock cluster simply aren’t as diversified as investors think.
Nov 24: The Dow Jones Industrials close above 30000 for the first time and stand about 60% above their March lows. The S&P 500 also sets a record.
Source: FT and Ariel Investments


