It has been more than a year since the market bottomed in Mar 2020.
As it turned out, the pre-collapse peak on Feb 19, 2020, was reclaimed in six months by Aug 18, 2020. The fastest 30% drop in history followed by an eye-popping, k-shaped recovery that baffled casual observers as the pandemic raged on in 2020.
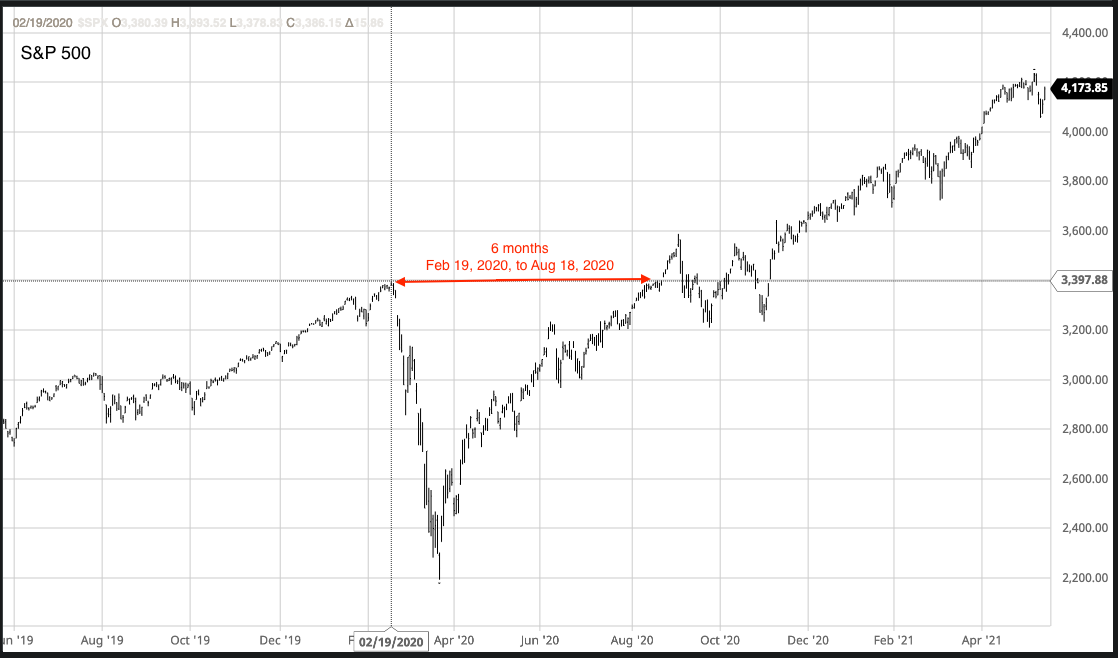
Source: S&P 500, barchart.com
The Federal Reserve deserves credit for this recovery. (Whether the Feds need to shoulder any blame for unintentional consequences, only history will tell.)
Thanks to lessons learned from the 2008 Great Financial Crisis, the Federal Reserve acted swiftly and decisively in Mar 2020, even breaking century-old taboos to lend widely, in the trillions, to businesses, states, and cities in its effort to insulate the US economy.
Commenters have since put forth thoughtful analysis and explanations about the recovery. The core narrative centers around:
- Optimism due to rapid vaccine development and distribution;
- Surge in day traders and young investors jumping into trading (with their stimulus cheques and ‘stick it to the man’ gusto); and
- Cheap money as the Federal Reserve kept interest rates near zero and continued “printing money”.
___________________________________________________________________
S&P 500 to the moon
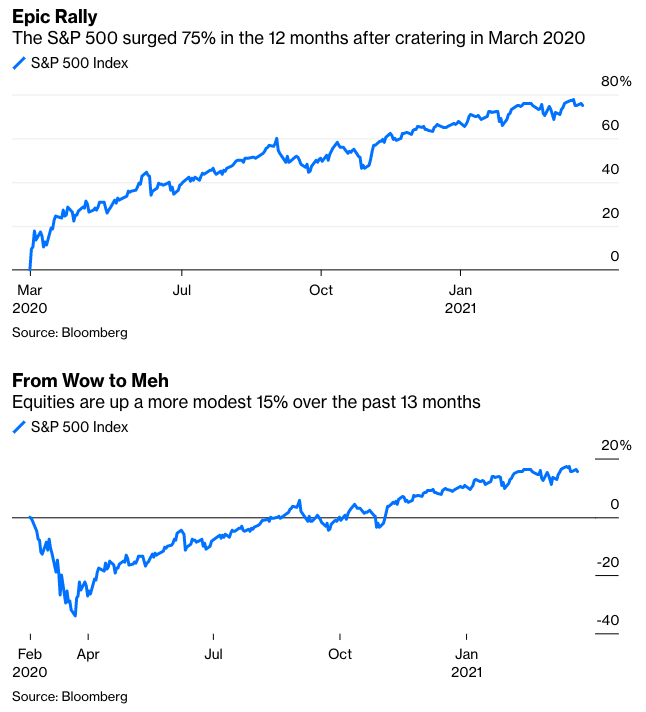
Speaking of cheap money, the S&P 500 posted its best 12-month performance in history between Mar 23, 2020, and Mar 23, 2021, gaining 74.8 percent.
This eye-watering rally fueled investors’ willingness to accentuate their stellar stock-picking record and shun professional fund managers.
However, an impressive 74.8 percent (and climbing) rally deserves a second look and lacks the proper context to fully understand an all-equities S&P 500 index.
Instead of looking at a 12-month chart that starts at the lows, go back 13 months. The S&P 500 is up 15.5 percent over that period.
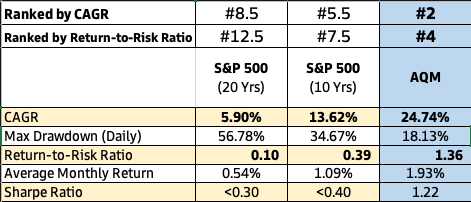
Source: S&P 500 and AQM research
To calculate the return-to-risk ratio of the S&P 500, take 13.62 percent CAGR divided by 34.67 percent (maximum daily drawdown).
The 0.39 ratio tells us that, in the past 10 years, the S&P 500 has delivered 0.39 units of return for every unit of risk.
An absolute return of 13.62 percent CAGR is impressive and not easy to beat.
Though this comes with two strong caveats:
- A handful of technology stocks were the primary drivers of outsized growth in the past decade.
- Do not get too starry-eyed about bagging 13.62 percent annual returns.
In the past 20 years, the S&P 500 has had a very wide range of historical returns: From a low of -38.49 percent (2008) to 28.88 percent (2019).
This is the typical fluctuation of an all-equities index — delivering high highs and low lows.
A lesson being: Do not expect to time the market to bag 13.62 percent returns the moment one is ready to cash out.
In technical terms, from a risk-adjusted return perspective, the S&P 500’s 0.39 return-to-risk ratio and a <0.40 Sharpe Ratio are far below average.
Compare the S&P 500 against two additional indexes:
- An industry benchmark for hedge funds: HFRI Asset Weighted Composite Index; and
- An industry benchmark for bonds: iShares Core U.S. Aggregate Bond ETF (AGG).
Source: HFRI, iShares, S&P 500, and AQM research
Observations:
- AGG at 0.86 offers more than twice the return-to-risk ratio relative to the S&P 500 at 0.39;
- AGG has a higher Sharpe Ratio at 0.89 compared to the S&P 500 at <0.40;
- At 13.62 percent CAGR, the S&P 500 is a worthy long-term investment. But with the caveat for an investor to ignore market gyrations (not an easy task!) and simply buy-to-hold; and
- The HFRI Index serves as a broad, composite gauge of global, single-manager funds. It takes time to parse through the universe of available funds to select a suitable investment style and return-to-risk profile.
___________________________________________________________________
Can investors have their cake and eat it too?
Industry veterans might point out that high performance is in fact not the holy grail in investing.
(In fact, beware of excessive bravado from fund managers who chase performance and downplay risk; in those instances, look into their incentive structure.)
A holy grail of investing is achieving high performance while taking on a lower level of risk. (The industry lingo is seeking consistent, risk-adjusted alpha.)
Using the S&P 500 as a reference point, can an investment strategy deliver >13.62 percent CAGR while taking on less risk?
The below table is a list of six peer funds compared to Alphalytics Quant Multi-Strategy (AQM). These are filtered from a longer list of 12 funds.
Source: HFRI, iShares, S&P 500, BarclayHedge, and AQM research
The funds in this list are industry award winners and notable funds mentioned by industry analysts when asked to name high-performance funds equivalent to AQM.
Fund II is ranked #1 by CAGR [49.82 percent]. Fund VII is ranked #1 by Return-to-Risk Ratio [2.74].
AQM is ranked #2 by CAGR [24.74 percent] and #4 by Return-to-Risk Ratio [1.36].
One takeaway is that there will always be trade-offs in fund selection.
For instance, subscribing to Fund II requires a minimum ticket size of USD5,000,000 and a 24-month lock-up period.
In addition, notice that AQM seeks to provide a smooth investment journey: High performance [24.74 percent CAGR] at an above average return-to-risk ratio [1.36 and a Sharpe Ratio of 1.22].
___________________________________________________________________
Conclusion
There are indeed funds that can beat the market. Specifically, the seven funds in the above table do so in a high-performance, risk-adjusted fashion — which is not an easy feat.
In this post, CAGR and Reward-to-Risk Ratio are highlighted as two tangible measures to evaluate a fund.
Keep in mind that these measures are starting points for an informed investor to conduct further due diligence to understand a fund’s investment philosophy and fit in their portfolio.
___________________________________________________________________
AQM Value Proposition
AQM seeks:
- 25 percent annualised returns;
- 1.5 Sharpe Ratio;
- 15 percent drawdown (maximum cumulative monthly); and
- To consistently beat the market in the long run.
AQM is an alpha-seeking strategy with a focus on high risk-adjusted returns.


